0 Introduction
The high-performance seed metering technology is used to improve seeding quality and achieve high-speed seeding[1-3]. Through centralized seeding and pneumatic conveying method, the pneumatic centralized system can avoid the problems of difficulty in filling and clearing seeds at high speed; and has the advantages of reducing seed damage rate and increasing adaptability for crops of different particle sizes. Therefore, the pneumatic centralized seeding technology has been one of the most important technical methods for high-performance seeding[4-5].
In recent years, pneumatic centralized seeding technology has developed rapidly in China[6-13]. For example, LEI et al.[6] carried out simulation analysis and experimental research on the structural parameters of the seed tube of the seed distributor. LIAO et al.[7] designed the dome-type seed distributor for the pneumatic centralized system and developed combined rape and wheat pneumatic centralized seeder. ZHANG et al.[8] developed the pneumatic centralized seeder of wheat and optimized the structural parameters of the distributor. DAI et al.[11] designed the pneumatic centralized seeder of rice and optimized the internal structure of the distributor. KUMAR et al. [14] proposed three outlet types of the seed distributor; and completed the simulation and experimental comparison research.
CFD (Computational Fluid Dynamics) is widely used to design the pneumatic centralized system. By analyzing the motion parameters of the internal flow field, the researchers can obtain the flow distribution, to optimize the structural parameters of the pneumatic centralized system[15-17]. However, CFD can only simulate the flow field, but not the movement of seed flow. With the development of computer simulation technology, CFD-DEM gas-solid coupling has been used to research the movement of the seed flow inside the pneumatic centralized system[18-25]. FLUENT is used to simulate the flow field, and EDEM is used to build the seed model. The movement law of the seeds flowing inside the pneumatic centralized system can be simulated by the combination of that software. Compared with the traditional flow simulation, CFD-DEM can obtain simulation results closer to the actual seed metering, so the accuracy of the results is easier to verify.
The study is based on the seed distributor, which is the main component of the pneumatic centralized system. The CFD-DEM coupling simulation method is used for experimental research, and the simulation results are verified by benches and field experiments. The T-type, Y-type, and M-type seed distributors were designed to improve the seeding quality of wheat seeds. The seed distributor with the best outlet type was selected for further structural parameter optimization research. The study has theoretical value and practical significance.
1 Materials and Methods
1.1 Design of the pneumatic centralized system
1.1.1 The structure and principle of the system
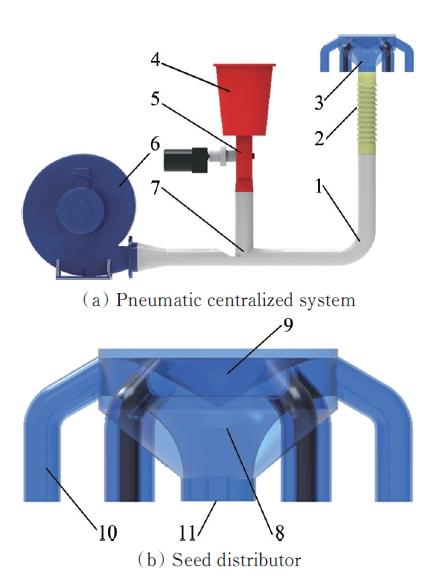
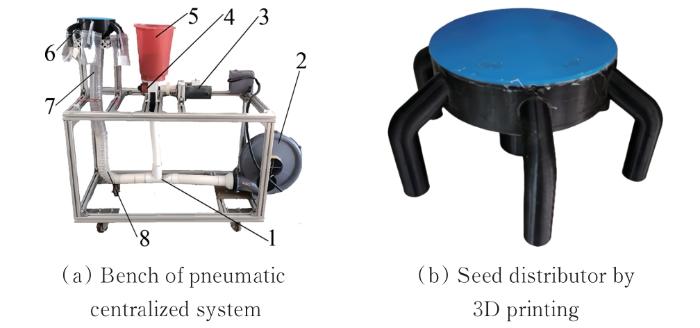
The pneumatic centralized system is shown in Figure 1(a), mainly including the fan, seed box, seed metering, air-seed mixer, seed tube, corrugated pipe, and seed distributor.
Figure 1
Figure 1
Structure of the pneumatic centralized system and seed distributor
1. Seed tube 2. Corrugated pipe 3. Seed distributor 4. Seed box 5. Seed metering 6. Fan 7. Air-seed mixer 8. Inner tube 9. Conical cover 10. Outlet 11. Inlet
The seeds discharged from the seed box and the airflow generated by the fan are mixed to form seed flow in the air-seed mixer, which enters the seed distributor through the corrugated pipe; and exits from the flow outlet after being equally divided.
The seed distributor is the main component of the pneumatic centralized system, as shown in Figure 1(b), it mainly includes a conical cover, inner tube, inlet, and several outlets. The seed flow enters the inner tube from the inlet, and under the guidance of the Y-type inner tube, the seed flow is equally divided and discharged from outlets. When the seed flow passes through the outlets, it will collide with the wall, which reduces the uniformity of seed metering. Therefore, the uniformity of seed metering can be improved by optimizing the outlet structure of the seed distributor.
1.1.2 Calculation of pneumatic conveying speed
The formation of seed flow depends on pneumatic conveying. Research shows that the damage rate of seeds increases at high speed, and the problem of accumulation occurs at low speed. Therefore, to reduce the damage rate, the minimum speed at which the seeds can be suspended is generally used as the pneumatic conveying speed of the seed flow. The suspension speed of wheat seeds is calculated by the
where, v0 is the suspension speed; Ks is the correction factor, the wheat seed is nearly spherical, Ks is 1.1; df is the equivalent particle size; ρf is the particle density; ρa is the air density; C is the coefficient of aerodynamic drag, which is 0.44 for wheat seeds; g is the gravitational acceleration. The measured results show that the particle density of wheat seeds is 1 335 kg/m³, and the equivalent particle size is 4.01×10⁻³ m.
According to
1.1.3 Analysis of seed particles in the outlet pipe
According to the relevant technical requirements of wheat and other major food crops in Shaanxi Province, the main technical parameters of the wheat pneumatic centralized seeder are determined as follows: the maximum working width of the seeder is 2 m, and the number of sowing rows is 6. According to the surface conditions of different planting areas of wheat, the control range of the working speed of the seeder is determined to be 4-12 km/h, and the sowing amount of dryland wheat is 130-140 kg/hm2. The seed metering device adopts the outer groove wheel seed metering device, the speed range is 20-60 r/min, the number of grooves is 10, and the adjustable length is 110 mm.
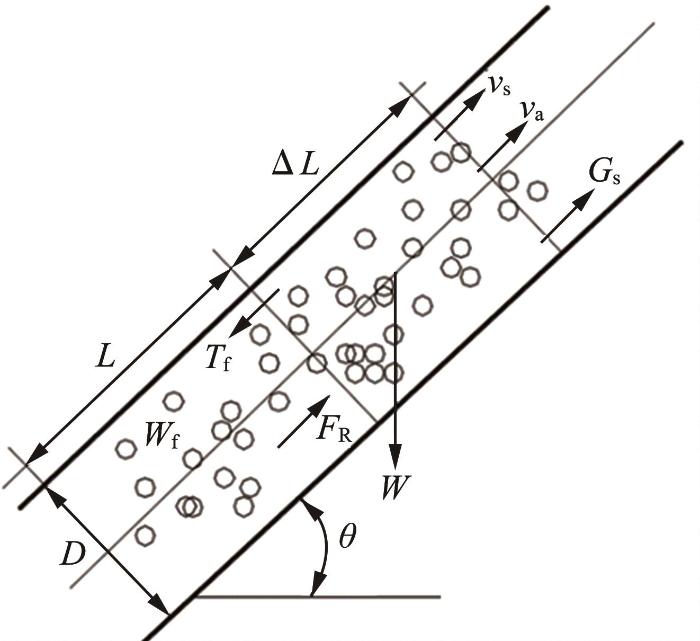
Based on the traditional Y-type seed distributor, the movement and force of seed particles passing through the inclined tube of the outlet were analyzed, as shown in Figure 2.
Figure 2
Figure 2
Force analysis of inclined pipe population
Under the combined function of gravity (W), drag force (FR), and viscous force (Tf), it is assumed that the seed flow passes through the distributor outlet at the speed vs without collision and rotation. The axial mechanical equilibrium equation of seed flow is established, as shown in
where, Gs is the mass flow; ΔL is the displacement of seed flow movement; t is the time of seed flow movement; θ is the angle between the inclined tube and horizontal plane. The force can be calculated by the
where, A is the frontal area of seed particles; μ is dynamic viscosity; r and D are the radius and diameter of the outlet pipe; Wf is the quality of seed particles transported per unit time.
1.2 Establishment of the simulation model
1.2.1 Simulation model establishment and calculation settings
The wheat seeds used in the experiment were “XINONG 585”. Based on the CFD-DEM coupling simulation method, EDEM 2021.2, and ANSYS Fluent 2021R1 software were used to carry out the coupling simulation of wheat seed flow and conveying airflow in the distributor. According to the parameter calibration method in Reference [28] and the technical requirements of wheat sowing, the CFD-DEM simulation parameters are determined as shown in Table 1.
Table 1 CFD-DEM simulation calculation parameters
| Item | Details | Index | Value | |
|---|---|---|---|---|
| CFD | Materials | Fluid/air | Density/(kg·m-3) | 1.225 |
| Viscosity/(kg·m-1·s-1) | 1.789×10⁻⁵ | |||
| Boundary conditions | Solid/PLA | Density/(kg·m-3) | 1 250 | |
| Velocity-inlet | Velocity magnitude/(m·s-1) | 28 | ||
| Turbulence | Turbulence intensity/% | 4 | ||
| Hydraulic diameter/mm | 50 | |||
| Flow-outlet | Outlet type | Flow-outlet | ||
| Wall | Wall motion | Stationary wall | ||
| Shear condition | No slip | |||
| DEM | Materials (wheat seeds) | Particle | overall dimensions/mm | 7.01×3.47×3.20 |
| Thousand-grain weight/g | 48.96 | |||
| Water content/% | 10.80 | |||
| Poisson’s ratio | 0.41 | |||
| Shear modulus/Pa | 4.79×10⁷ | |||
| Density/(kg·m-3) | 1 350 | |||
| wall | Poisson’s ratio | 0.35 | ||
| Shear modulus/Pa | 1.3×10⁹ | |||
| Density/(kg·m-3) | 1 250 | |||
| Interaction | Particle-particle | Coefficient of restitution | 0.47 | |
| Coefficient of static friction | 0.55 | |||
| Coefficient of rolling friction | 0.28 | |||
| Interaction contact model | Hertz-Mindlin | |||
| Particle-wall | Coefficient of restitution | 0.50 | ||
| Coefficient of static friction | 0.22 | |||
| Coefficient of rolling friction | 0.16 | |||
| Interaction contact model | Hertz-Mindlin | |||
| Particle | Particle generation | Particle radius/(mm×mm×mm) | 7.00×3.20×3.20 | |
| Factory type | Dynamic/unlimited number | |||
| Generation rate/(s-1) | 2 000 |
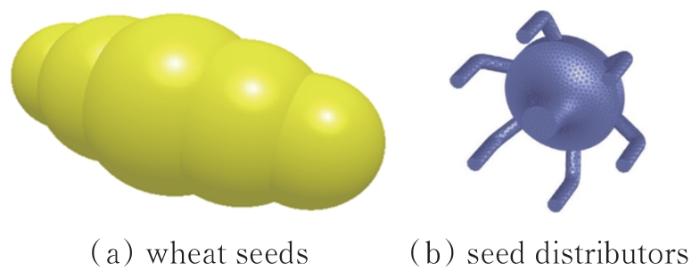
According to the measured physical parameters, the manual filling of the 5-ball model is established through the EDEM software, as shown in Figure 3.
Figure 3
Figure 3
Simulation model of wheat seeds and
seed distributors
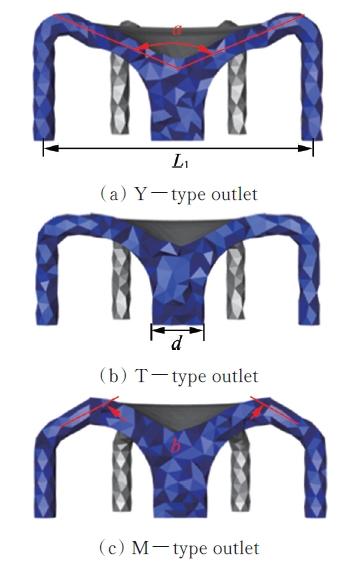
The seed distributor simulation model is established through the CFD software, as shown in Figure 3 and Figure 4. The outlet of the Y-type seed distributor is upward, and the angle of outlet a is 120°, the outlet of the T-type seed distributor is horizontal, the outlet of the M-type seed distributor is downward, and the angle of outlet b is 120°. The inlet diameter and outlet size of the three types of seed distributors are d=60 mm and L1=300 mm respectively.
Figure 4
Figure 4
Simulation models of Y, T, and M type seed distributors
1.2.2 Simulation methods and boundary conditions
The gas-solid coupling simulation is carried out in ANSYS software. The N-S calculation model is used to solve the motion of the seed flow, the inlet velocity of wheat seeds is 28 m/s, and the seed production rate is 2 000 per second. The Realizable k-ε model is used to describe the airflow movement.
1.2.3 Calculation method of simulated experiment index
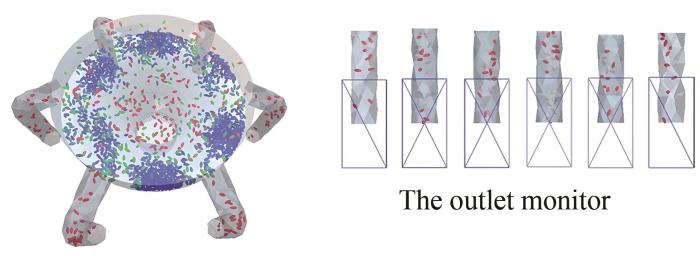
Evaluating the quality of seed metering involves using the coefficient of variation of seeding uniformity in accordance with the standards of seeder operation quality as defined in GB/T 9478—2005[29]. By setting the monitor in the EDEM software, the number of seeds discharged at each outlet can be obtained to calculate the number of seeds, as shown in Figure 5.
Figure 5
Figure 5
Gas-solid coupling simulation of the seed distributor and the outlet monitor
The coefficient of variation of seeding uniformity is calculated as shown in
where, xi is the number of seeds in outlet i; x is the average amount of seeds; S is the standard deviation of the seeding uniformity; V is the coefficient of variation of seeding uniformity, %; n is the number of outlets (n=6 in this study).
1.3 Verification of simulation results
1.3.1 Bench experiment
The bench experiment was used in the laboratory of Northwest A&F University to verify the simulation results, as shown in Figure 6. The M-type seed distributor is manufactured by 3D printing technology. Through the self-made experiment bench, the seed rate of each outlet is measured, and the coefficient of variation of seeding uniformity is calculated by the
Figure 6
Figure 6
Device for the bench experiment
1. Mixer 2. Speed regulating fan 3. Speed regulating motor 4. Outer groove wheel seed metering device 5. Seedbox 6. Seed distributor 7. Corrugate pipe 8. Gas seed conveying pipeline
1.3.2 Field experiment
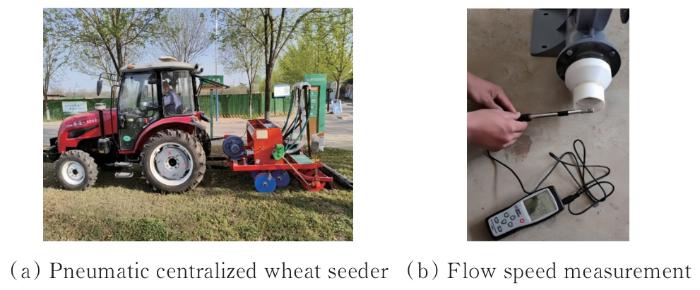
The field experiment was carried out on the farm of Northwest A&F University to verify the simulation results, as shown in Figure 7.
Figure 7
Figure 7
Device for a field experiment
LUTONG-55 tractor drags the pneumatic centralized wheat seeder, and the forward speed is 10 km/h in the field experiment. The soil of the field is typical columbine soil in Shaanxi, the water content measured by the oven drying method is 17%, the average compaction of tillage layer soil (0-10 cm) is 10 kPa. The rotary tillage is prepared before seeding, to level the field.
The sampling is obtained by setting the inoculation bag at the end of the seed tube in the field experiment. The seed rate in each inoculation bag is measured, and the coefficient of variation of seeding uniformity is calculated by the
2 Results and discussion
2.1 Simulation results and analysis
2.1.1 Velocity of the flow field and seed particles distribution
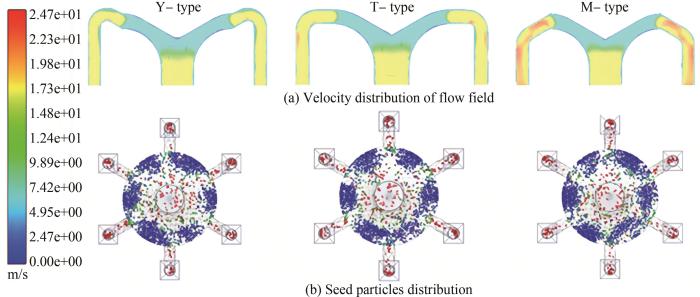
The seed particles and flow field velocity distribution of Y-type, T-type, and M-type seed distributors are shown in Figure 8. The horizontal and vertical sections of the outlets are established respectively. The results show that the flow field velocity at the outlets of the M-type seed distributor is higher than the Y-type and T-type, and the M-type seed distributor has lower pressure loss than the other two types. The three types of seed distribution have seed particle accumulation, and the M-type seed distributor has little accumulation of seeds and has better uniformity than the other two types. The pressure loss of the seed flow through the M-type seed distributor is less than the other types, therefore, the seed flow can quickly pass through the seed distributor, and avoid the accumulation of the seeds.
Figure 8
Figure 8
Seed particles and flow field velocity distribution of Y-type, T-type, and M-type seed distributors
The coefficient of variation of seeding uniformity is calculated by the
Table 2 The simulation results of three types of distributors
| Type of distribution | Y-type | T-type | M-type |
|---|---|---|---|
| The coefficient of variation/% | 10.95 | 14.64 | 7.23 |
The simulation result shows that compared with the T-type and Y-type seed distributors, the coefficient of variation of seeding uniformity of the M-type seed distributor is reduced by 7.41% and 3.72% respectively. The seed accumulation in Y-type and T-type seed distributors cases the difference of seed rate in each outlet, and the coefficient of variation of seeding uniformity increased.
2.1.2 Single factor test of different structure parameters of M-type distributor
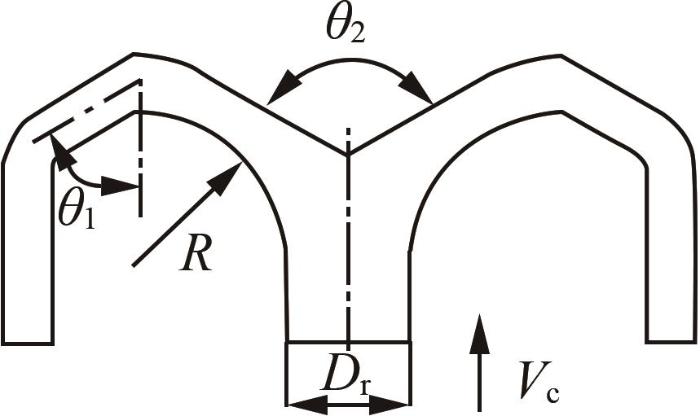
As shown in Figure 9, the structure parameters of the M-type distributor include the inclination of outlet pipe θ1, the cone angle of top cover θ2, inlet diameter Dr, fillet radius R, and pneumatic conveying speed Vc.
Figure 9
Figure 9
Structural parameters of M-type distributor
Table 3 Factor level table
| Factors | Level |
|---|---|
| The inclination of outlet pipe θ1/(°) | 50, 55, 60, 65, 70 |
| The cone angle of the top cover θ2/(°) | 100, 120, 140, 160, 180 |
| The inlet diameter Dr/mm | 56, 58, 60, 62, 64 |
| The fillet radius R/mm | 62, 66, 70, 74, 78 |
The pneumatic conveying speed Vc/(m·s-1) | 28, 30, 32, 34, 36 |
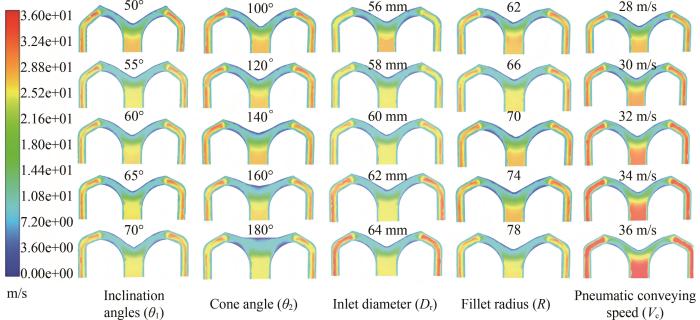
Figure 10
Figure 10
Velocity distribution of the longitudinal section under different factor levels
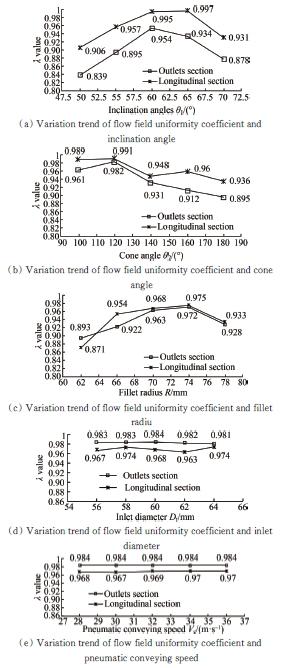
Flow field uniformity coefficient (λ) based on both area-weighted and mass-weighted average velocity as an evaluation index of flow field uniformity of seed distributor.As shown in Figure 11, the λ values of the outlet’s section and longitudinal section are under different factor levels.
Figure 11
Figure 11
λ values of the outlet’s section and longitudinal section under different factor levels
The single factor test results show that the inclination angle of outlet pipe θ1 has a significant effect on the flow field uniformity of both the outlet’s section and longitudinal section, and with the increase of the inclination angle from 50° to 70°, the λ value increases to a maximum and then decrease.
When the inclination angle is 60°, the λ value of the outlet’s section reaches a maximum of 0.954. When the inclination angle is 65°, the λ the value of longitudinal section reaches a maximum of 0.997. The reason may be that when θ1 is relatively small, the flow line at the connection between the inner tube and outlet is stable, but it is sharp at the end of the outlet.
The cone angle of top cover θ2 has a significant effect on the flow field uniformity of both the outlet’s section and longitudinal section, and with the increase of the cone angle from 100° to 180°, The λ value keeps decreasing. When the cone angle is 120°, the λ value of both the outlet’s section and longitudinal section reach the maximum, respectively 0.982 and 0.991. This is consistent with the research results of the optimal parameters of LEI et al.[6] in the seed distributor cone angle.
The fillet radius R has the same trend as the inclination angle θ1, with the increase of the inlet diameter from 62 mm to 78 mm, the λ value increases to a maximum and then decreases. When the inlet diameter is 74 mm, the λ value of both the outlet’s section and longitudinal section reach the maximum, respectively 0.972 and 0.975.
The inlet diameter Dr
In summary, the structural parameters of the M-type distributor affect the flow field uniformity, of which the inclination of outlet pipe θ1, the cone angle of top cover θ2, and the fillet radius R have a significant effect, and the inlet diameter Dr, the pneumatic conveying speed Vc has no significant effect.
2.1.3 Multi-factor orthogonal experiment based on CFD-EDM coupling
Based on the results of the single-factor test of different structure parameters of the M-type distributor, the multi-factor quadratic rotation orthogonal experiment based on CFD-EDM coupling is used to obtain the optimal structure parameter combination of the seed distributor. The factor level table is shown in Table 4. The coefficient of variation of seeding uniformity is the experiment index. The inlet diameter Dr and pneumatic conveying speed Vc is 60 mm and 28 m/s respectively.
Table 4 The factor level table of the multi-factor orthogonal experiment
| Level | The inclination angle θ1/(°) | The cone angle θ2/(°) | The fillet radius R/mm |
|---|---|---|---|
| -1 | 55 | 100 | 66 |
| 0 | 60 | 120 | 70 |
| 1 | 65 | 140 | 74 |
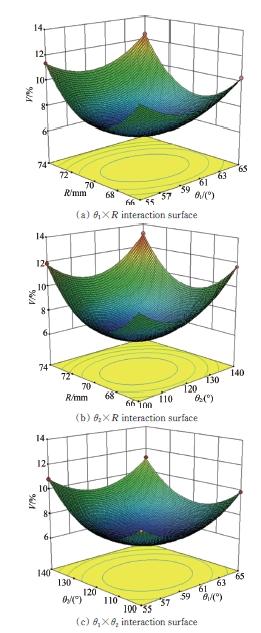
As shown in Figure 12, the experimental results show that all the main factors have a highly significant effect on the coefficient of variation of seeding uniformity (P≤0.01). In addition, the interaction of the inlet diameter and the cone angle has a highly significant effect too.The results of response surface analysis show that with the increase of outlet pipe inclination angle, the cone angle of the top cover and the fillet radius increase, and the coefficient of variation of seeding uniformity decreases first and then increases. The reason is that when the outlet pipe inclination angle is large or small, the internal flow field of the seed distributor will produce an eddy current, which will lead to uneven seed discharge.
Figure 12
Figure 12
Response surface analysis of the interaction between experimental factors
The volume of the flow field inside the seed distributor is affected by the fillet radius. When the space is large, the airflow will form more turbulence and vortex. When the space is small, the collision of seed particles will increase, and both the vortex and collision will lead to uneven seed discharge.
Parameter optimization analysis of the regression equation was finished by using Design Expert software, the results showed that the optimal combination of structural parameters of the seed distributor was: the cone angle of the top cover was 117.03°, the inclination angle of the outlet pipe was 59.50°, the internal fillet radius was 69.46 mm, and the minimum coefficient of variation of seeding uniformity was 6.05%.
2.2 Verification results and analysis
The bench experiment and field experiment were used to verify the simulation results. Based on the optimal combination of the structure parameter of the M-type seed distributor, the simulation experiment is carried out. The verification result of the M-type seed distributor is shown in Table 5.
Table 5 Verification result of M-type seed distributor
| Index | Calculated result | Simulation experiment | Bench experiment | Field experiment |
|---|---|---|---|---|
The value of coefficient/% | 6.05 | 6.03 | 7.03 | 7.58 |
The relative deviation of the M-type seed distributor between the simulation result and verification result of bench and field is 1.00% and 1.55% respectively. The coefficient of variation of seeding uniformity in the bench experiment and field experiment is 7.03% and 7.58% respectively. The data of the three measurement samples from the field experiment show that the upper and lower deviation is much higher than that in the bench experiment.
The verification results show that the coefficient of variation of seeding uniformity in the field experiment is higher than that in the bench experiment, and there is no difference in the results of the bench experiment and the simulation experiment. This is because field operations are greatly affected by soil conditions and the machinery, for example, the performance of the seed metering device and the field vibration of the seeder will affect the experiment results. Under the same operation parameters, the average seeding rate in the field experiment is higher than that in the bench experiment, which shows that the field vibration can promote seeding of the pneumatic centralized system and the effect is significant.
3 Conclusion
1) Compared with the T-type and Y-type seed distributors, the M-type seed distributor can significantly improve the seeding quality of the wheat, and the simulation test shows that the coefficient of variation of seeding uniformity is reduced by 7.41% and 3.72% respectively.
2) The structural parameters of the M-type distributor affect the flow field uniformity, of which the inclination of outlet pipe θ1, the cone angle of top cover θ2, the fillet radius R have a significant effect, and the inlet diameter Dr, pneumatic conveying speed Vc has no significant effect, and multi-factor orthogonal experiment results show that the optimal combination of structural parameters is θ2=117.03°, θ1=59.50°, R=69.46 mm, the minimum coefficient of variation of seeding uniformity obtained through simulation experiment is 6.05%.
3) The coefficient of variation of seeding uniformity in the bench experiment and field experiment is 7.03% and 7.58% respectively. The absolute errors of the M-type seed distributor between the simulation result and verification result of bench and field are 1.00% and 1.55% respectively.
Reference
Real time laboratory and field monitoring of the effect of the operational parameters on seed falling speed and trajectory of pneumatic planter
[J].
Design and test of the maize posture control and driving precision metering device for high-speed seeder
[J].
Design and simulation for seeding performance of high-speed inclined corn metering device based on discrete element method (DEM)
[J].
Establishing the conveying parameters required for the air-seeders
[J].
Seeding performance of air-assisted centralized seed-metering device for rapeseed
[J].
Simulation of seed motion in seed feeding device with DEM-CFD coupling approach for rapeseed and wheat
[J].
Design and test of an inside-filling pneumatic precision centralized seed-metering device for rapeseed
[J].
Design and experiment of wheat pneumatic centralized seeding distributing system
[J].
Design and experiment of pneumatic seeding system of teff seeder
[J].
Design and parameter optimization of rice pneumatic seeding metering device with adjustable seeding rate
[J].
Design and experiments of the key components for centralized pneumatic rice dry direct seeding machine
[J].
Parameter optimization and experiment of air-assisted centralized seed-metering device of direct seeding machine for rape and wheat
[J].
Optimal design and experiment of pneumatic and pneumatic collecting and discharging system of alfalfa cut-root reseeding and fertilizer applicator
[J].
Influence of head geometry on the distributive performance of air-assisted seed drills
[J].
CFD simulation and improvement of air-stream distributive metering device
[J].
CFD simulation methodology for gas-solid flow in bypass pneumatic conveying-A review
[J].
Flow field characteristics of pneumatic conveying system in air seeder: A review
[J].
A review of pneumatic conveying status, advances and projections
[J].
Numerical simulation of particle motion characteristics in quantitative seed feeding system
[J].
Numerical simulation of two-phase "air-seed" flow in the distribution system of the grain seeder
[J].
Possibilities and limits of computational fluid dynamics-discrete element method simulations in process engineering: a review of recent advancements and future trends
[J].
Distribution characteristics and parameter optimization of an air-assisted centralized seed-metering device for rapeseed using a CFD-DEM coupled simulation
[J].
Design and test on distributor device of air-assisted centralized metering device for rapeseed and wheat
[J].
Numerical simulation of feed pellet breakage in pneumatic conveying
[J].
Simulation and parameter optimization of seed metering device based on CFD-DEM
[J].
Experimental analysis of particle velocity and acceleration in vertical dilute phase pneumatic conveying
[J].
Establishment and calibration of discrete element model for buckwheat seed based on static and dynamic verification test
[J].


